I hope you’re enjoying the holiday season!
As year end approaches, I wanted to share a few encouraging statistics about the investment world and economy:
- In November the S&P 500 (large US companies) increased by 8.9%. This was the 18th-best monthly gain since 1950. As a result, the index is close to an all-time high, last recorded in January, 2022.
- Going back further in time, from December 31st, 2018, to December 12th, 2023 (just shy of 5 years), the S&P 500 has gained 102%. Said another way, US stocks have doubled over the last 5 years. That’s pretty amazing given the two bear markets (2020 and 2022), a worldwide pandemic, high inflation, and rising interest rates.
- Also in November, US bonds appreciated by 4.5%. This was their 8th-best monthly gain since 1976.
- America’s third quarter GDP was revised up from 4.9% to 5.2%.
- Gas prices are at their lowest level of the year, with a national average of $3.10 ($4.65 in CA).
- On the employment front, the unemployment rate has been below 4% for 22 straight months. That hasn’t happened since the 1960s. The unemployment rate didn’t go below 4% once during the 1970s, 1980s or 1990s.
Despite these positive results, many people remain dissatisfied with today’s economy.
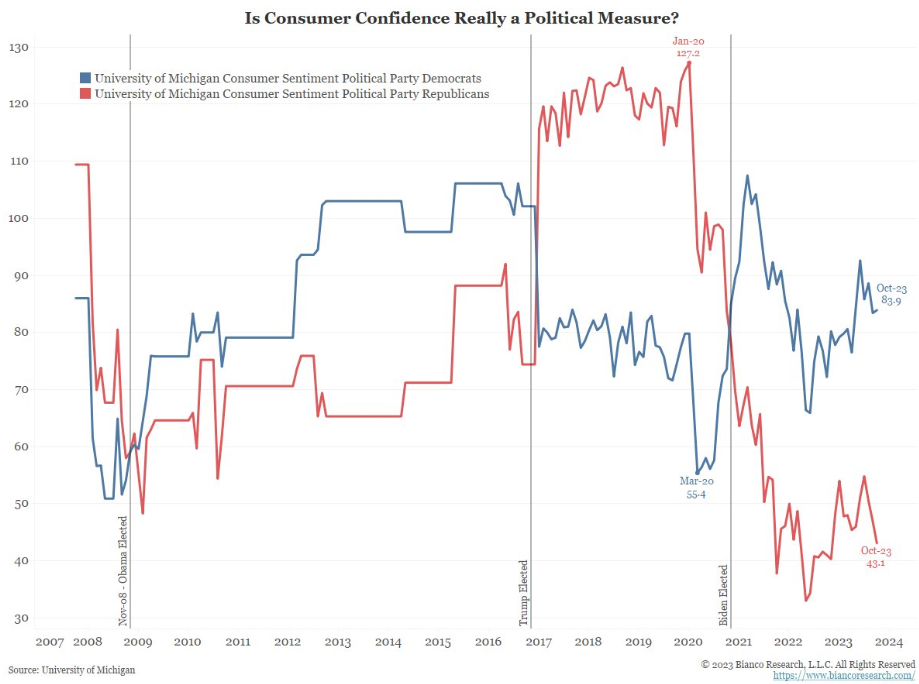
The chart below provides an excellent insight: It shows consumer sentiment by political party. Looking at the drastic swings when a presidential election occurs, it appears that the dominant factor in one’s outlook on the economy is how one identifies politically, and which party occupies the White House:
Personal Finance News
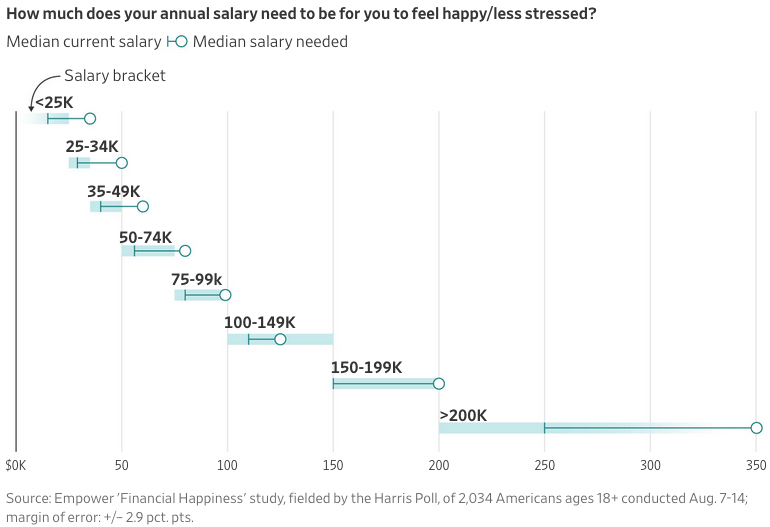
Empower surveyed people and asked how much money it would take to feel happy/less stressed.
The result: Across all income levels, everyone felt that earning more money would make them happier/less stressed. Even the highest earners surveyed, with a median income of $250,000, gave a median response of $350,000. Our desire for more is ever-present:
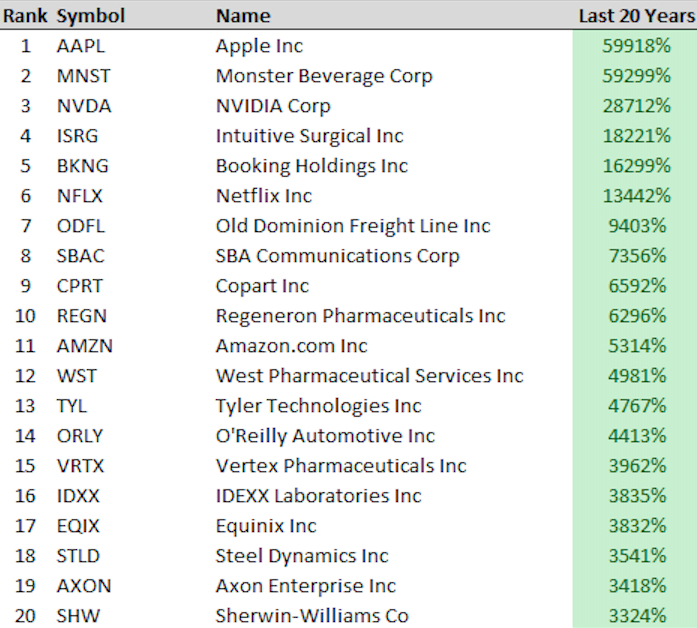
What’s the best-performing stock over the past 20 years?
If you guessed Apple, you’re right! It’s an amazing run, but also interesting to see what other companies are on the list. I don’t think many people would’ve guessed Monster Beverage would be #2:
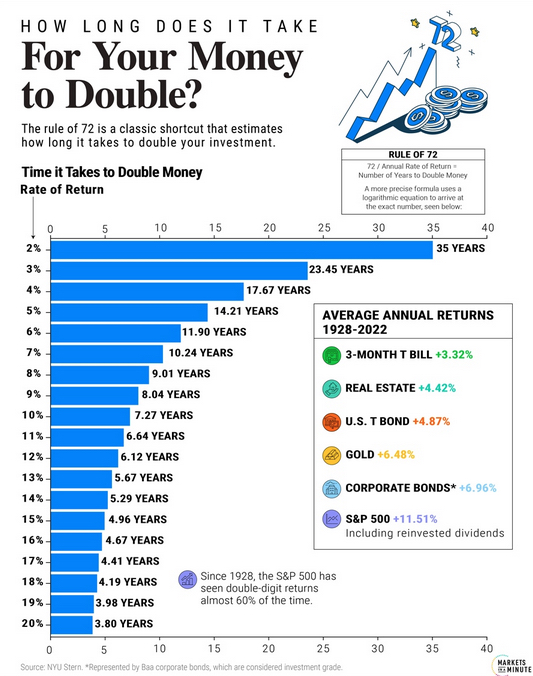
Speaking of investment returns, the image below from Visual Capitalist does a nice job showing how long it takes to double your money:
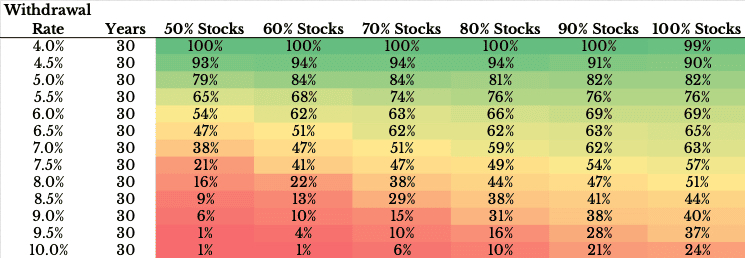
This research about the Safe Withdrawal Rate from your portfolio in retirement is interesting.
The green section across the top represents the safe withdrawal rate, where you would not have run out of money in nearly all historical periods. But as you move down the table – by increasing your withdrawal rate – you become more likely to run out of money. So when you have a high withdrawal rate you actually need to take more risk to accommodate this higher need from your portfolio.
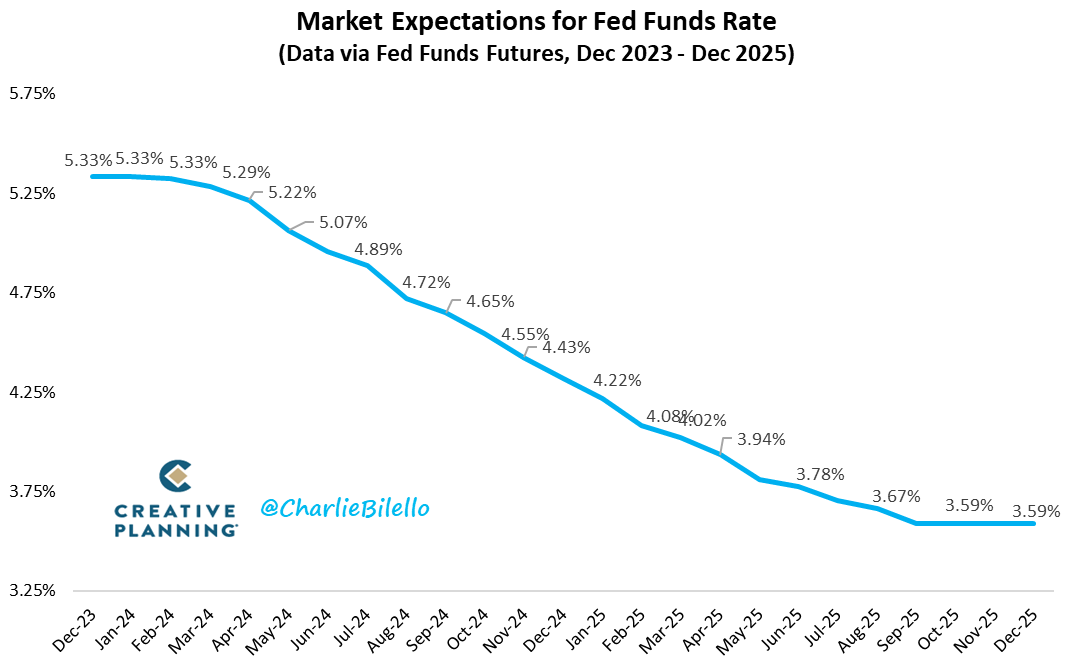
Interest rates are on a lot of people’s minds these days. Recently the Federal Reserve decided to hold them steady, and it’s projected that they’ll be reduced over the next few year. Here are the current projections for where they’re headed (take these with a grain of salt, as these projections move around a lot):
I hope you found these as interesting as I did.
As always, please reach out if you have any questions or would like to connect.
Happy Holidays!
