Hack of National Public Data

Hack of National Public Data

I’d like to inform you of a data breach involving a company called National Public Data.

This company is involved in running background checks, and a few months ago they were hacked. As a result, a significant amount of personal information – including Social Security numbers, addresses, phone numbers, and dates of birth – was stolen and released publicly.

You can read about the hack in this article.

To see if your information was compromised, click here.

Whether your data was affected or not, I recommend placing a freeze on your credit. This is free, won’t affect your credit score, and should only take 10-15 minutes. Just set up an account with Experian, TransUnion, and Equifax.

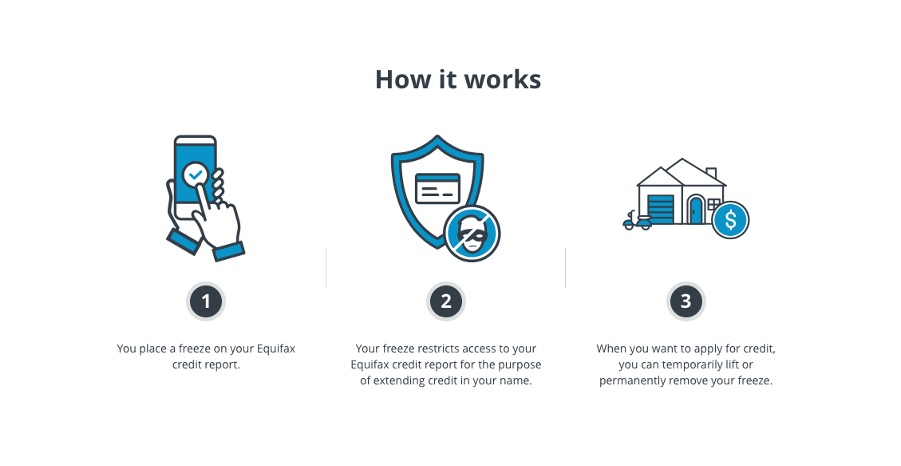
Here’s a nice explainer from Equifax on how a freeze helps:

Please reach out if you have any questions or need further assistance.

Monthly Financial News – July 2024

Monthly Financial News – July 2024

When planning this month’s newsletter two weeks ago, what stood out at the time was how little volatility there had been in 2023 and 2024. That seems to have changed recently, which goes to show how quickly things can change in investing.

Below are a few interesting personal finance pieces from the past month, starting off the with volatility piece.

Stock Market
  • Low Volatility? – Through most of 2024 there had been very little movement in the stock market. That changed around the middle of July.
  • Below is a dot plot showing the daily returns of the S&P 500. Compared to previous years, 2024 had been especially quiet (until the past couple of weeks):
  • But since July 10th, the Nasdaq 100 – an index of large tech companies – has decreased by ~13%, while the S&P 500 is down about 8%. It appears volatility has returned:
  • Stock Picking is Hard – Over this time, only about 20% of individual stocks have outperformed the S&P 500 index:
  • Tons of Funds – Despite the difficulty of being an active investor, many try.
  • There are about 5,000 US stocks to invest in, but there are around 12,000 funds (and growing)!
  • President vs. Stock Market – With the presidential election coming up, I wanted to share the chart below. The way I interpret it is that the stock market tends to go up over time, regardless of who is in power.

Jobs & Economy

  • America’s Female Workforce is Expanding – “The share of women aged 25-54 that are working or looking for work reached an all-time high of 78.1% in May…meaning that women now hold a record 79 million jobs across the US.”
  • Q2 GDP – In good news for the US economy, “Gross domestic product — the value of all goods and services produced in the US…rose at an annual rate of 2.8% for April through June.
  • That was faster than the 1.4% pace in the first quarter, and well above the 2.1% rate economists had expected.
  • Strong Economy – Below is a nice snapshot of US economic indicators. These are great results across the board.
  • Soft Landing – This is a big deal. Many predicted that bringing down the inflation rate, and bringing up interest rates, would cause a recession.
  • As the economy continued to expand from April through June [growing GDP], inflation resumed a downward trend and seems to be on track to slowing further toward the Federal Reserve’s 2% target.
  • America’s economy is about to stick what’s called a ‘soft landing,’ which is when inflation returns to the Fed’s target without a recession — a feat that’s only happened once, during the 1990s.”
  • More Good News – This stat is hard to believe: In 2000, 75% of adults held $10,000 or less in wealth.
  • That number is now down to 40%. A great step in the right direction.
  • On the other side of the wealth spectrum, 1.5% of Americans have $1M+ (up from 0.5% in 2000).
  • Inflation is Down, but Prices Aren’t – “The typical household is spending $925 more a month to purchase the same goods and services as three years ago, according to Moody’s Analytics.”
  • Consumer prices increased by 3% year-over-year in July, according to the Bureau of Labor Statistics. That’s an improvement from the 9% rate of inflation in June, 2022. Yet many Americans are not feeling great about that, as prices are still higher than they were last year – they’re just rising at a slower pace.

Housing

  • Price Drops – “Roughly one in five (19.8%) homes for sale in June had a price cut — the highest level of any June on record.”
  • That’s up from 14.4% a year earlier and is just shy of the 21.7% record high set in October 2022.”
  • Closed Homes Sales – The number of homes that sold in June increased in just one metro: San Jose, CA (1.8% growth).
  • Also in San Jose, 72% of homes sold above their final list price, the highest share among all metros.
  • Interesting Housing Charts – There are a lot of great charts about the housing market in this report from Apollo. If you’re interested in real estate I highly recommend it.
  • Here are a few favorites:
  • “Portfolios of foreclosed and seized office buildings, apartments and other commercial property reached $20.5 billion…that is a 13% increase from the first quarter and the highest quarterly figure since 2015.”

Taxes

  • Inherited IRA Rules Clarified – If you inherited an IRA from someone who was not your spouse, you may be familiar with the 10-year rule for required distributions. The IRS has clarified those rules to the following:
  • “If the person who died was required to take withdrawals, the person who inherits the account must take annual payouts starting the year after death. The law mostly affects children and other inheritors, like grandchildren, siblings and friends.
  • Because there has been confusion about the new rules, many people didn’t take distributions in the past several years. The IRS has essentially excused them, saying it won’t penalize people in this situation for failing to take required payouts for the years 2021 through 2024.”
  • Gas Tax – “California pumps out the highest state gas tax rate of 77.9 cents per gallon (cpg), followed by Illinois (66.5 cpg) and Pennsylvania (62.2 cpg).
  • The lowest state gas tax rates can be found in Alaska at 9.0 cents per gallon, followed by Missouri (17.5 cpg) and Mississippi (18.4 cpg)”
Quote of the Month

“Wealth is like seawater: the more we drink, the thirstier we become.”

– Arthur Schopenhauer

I hope you found these interesting.

As always, please reach out if you have any questions or would like to connect.

Monthly Financial News – June 2024

Monthly Financial News – June 2024

We just crossed the halfway mark of the year, so let’s see how the stock market is doing.
Stock Market
  • All Time Highs – The stock market started the year well, rising 14.5% and ending June at an all-time high.
  • This was the 15th best start to a calendar year since 1928:
  • Slow & Steady – One thing interesting about this market: How slow, steady, and almost boring the upward movement has been.
  • This year there have been zero days when the S&P 500 has declined by more than 2%, and just seven days with performance of -1% or worse.
  • In times like these when the markets are performing well, it’s good to remember the concept of loss aversion. That is, the pain of losing is felt more intensely than the joy of gaining something equivalent.
  • Said another way, losing $100,000 feels much, much worse than the joy of gaining $100,000.
  • This year, most people are seeing that their portfolio is performing well, but they don’t necessarily feel great about it. If, on the other hand, they were down the equivalent amount that they are up, they’d be worried, upset, etc.
  • Just a reminder to be thankful for and enjoy the good times!.
  • Active Managers Underperform – “In the first half of 2024, according to Morningstar, only 18.2% of actively managed mutual funds and exchange-traded funds that compare themselves to the S&P 500 managed to outperform it.”
  • Market Cap per Employee – Nvidia stands out in this wild chart. It looks at how much a company is worth (market capitalization) divided by how many people they employ:
  • High Expectations – “The top 10 companies in the S&P 500 make up 35% of the market cap but only 23% of earnings…the problem for the S&P 500 today is not only the high concentration but also the record-high bullishness on future earnings from a small group of companies.”
Jobs
  • Silicon Valley Salaries are Shrinking – Despite having the highest tech salaries in the country, Silicon Valley has experienced the biggest drop in pay compared to other tech hubs, falling 15% from 2022 to 2023
  • Promotion Recession – “Out of 68 million white collar workers, just 1.3% were promoted in the first quarter, the lowest rate in five years. Employers now hold more leverage, reducing the need to move employees up the ladder in order to retain them.”
  • Lots of Construction Spending – As a result of the CHIPS Act, the Inflation Reduction Act, and the Infrastructure Act, construction spending on manufacturing has skyrocketed:
Housing
  • Mortgage Rate Dispersion – 80% of millennials have a mortgage rate under 5%. Only 52% of Gen Z borrowers can say the same:
  • “Months Supply” – This measure tracks how many months it would take to sell all the homes currently on the market if no new homes were listed for sale. Recently it has moved up, indicating that the supply of homes for sale is trending up:
Life
  • American Parents Are Not OK – “American parents appear to be under more financial pressure than usual as inflation and rising childcare costs continue to bite, with less than two-thirds of American parents saying they’re doing “at least okay.”
  • It’s also interesting to note the huge disparity during the Covid years.
  • The C Word – One of my favorite financial writers, Jonathan Clements, recently learned that he has terminal cancer. He has about 1 year left to live, and at age 61 his take on receiving the news is well worth reading.
  • Lazy Work, Good Work – “Productive work today does not look like productive work did for most of history. If your job was to pull a lever, you were only productive if you were pulling the lever. But if your job is to create a marketing campaign, you might be productive sitting quietly with your eyes closed, thinking about design.”
Quote of the Month

“No one compares themselves [financially] to the average American. It’s who you hang out with”

Michael Batnick
Animal Spirits

I hope you found these interesting.

As always, please reach out if you have any questions or would like to connect.

Monthly Financial News – May 2024

Monthly Financial News – May 2024

There was lots of housing news this past month, so we’ll start there:
Housing
  • Home Price Growth by Decade – “Through the first 50 months of the 2020s decade, U.S. home prices have risen by 47%. This already surpasses the total national appreciation witnessed throughout both the 1990s and 2010s [full] decades:”
  • 1-Year Growth – Home prices have risen 6% over the last year, and hit a record high 8 months in a row.
  • Million-Dollar Cities – Also as a result of the recent appreciation, there are now 550 U.S. cities where the typical home value is $1 million or more.
  • Monthly Mortgage Payment – Unfortunately, the monthly mortgage payment required to purchase the median U.S. home has doubled since 2021:
  • First Time Home Buyers – Even with high interest rates and prices, first-time home buyers remain the majority of buyers, purchasing 58% of all homes.
  • Home Sales Slowdown – High housing costs are having an impact on purchase activity. The number of homes that sold in April fell 1.9% as compared to March. That was the second consecutive monthly decline.
  • How to Save – Tips to save on your homeowners and auto insurance policy.
  • Shelter’s Effect on Inflation – Shelter makes up more than 40% of the core Consumer Price Index (CPI). Not everyone is affected by the change in home-price affordability, or rent increases.
  • Given that, if you exclude shelter from the index, the inflation rate is just above the 2% level that the Fed is targeting:
Investing
  • Expected interest rate cuts, healthy economies, and positive company earnings are driving these results.
  • There’s also plenty of potential drivers to keep the momentum going, such as the $6 trillion sitting in money market funds..
  • The chart below summarizes the performance of the global stock market this year:
  • Utility Stocks Are Hot? – “These dullest of all stocks have suddenly become a bet on the single flashiest area of the market: artificial intelligence. AI requires a lot of computing power, and computers use a lot of electricity.
  • Three of this year’s five best-performing stocks in the S&P 500 are utilities: Vistra, Constellation Energy and NRG Energy. Vistra, up 143%, has even outperformed the king of AI itself, Nvidia; Constellation, up 85%, is barely behind it.”.
  • Answer: 1915. The Dow was up 80% that year, on the heels of World War I (which began in 1914). In fact, the market was up 9% per year through all of World War I. Pretty surprising.
  • Investing vs. Geopolitics – Speaking of investing during geopolitical challenges, here’s a chart showing how the stock market did during major events. Generally speaking, it performed well:
Apple
  • Revenue Growth – Apple’s revenue fell 4% over the last year. This was the 5th negative year-over-year growth rate in the last 6 quarters.
  • Stock Buybacks – From Charlie Bilello, “Apple is the undisputed king of buybacks. Over the past decade, it has bought back $625 billion in stock. That’s greater than the market capitalization of 492 companies in the S&P 500.”
  • A stock buyback is when a company uses its cash to buy its own shares. That reduces the number of shares available for purchase by the general public. Apple is essentially taking those shares off the market. That move increases certain key metrics, like earnings per share.
Quote of the Month

“Two people who make the same income today will likely end up in distinctly different places over the years based on their approach to career and money.”

Scott Galloway
The Algebra of Wealth

I hope you found these interesting.

As always, please reach out if you have any questions or would like to connect.

Monthly Financial News – April 2024

Monthly Financial News – April 2024

Here are a few interesting personal finance pieces from the past month:

Artificial Intelligence

  • Nvidia CEO on 60 Minutes – A good interview with Jensen Huang. It highlights how AI is being applied across a number of industries. Examples include: developing proteins to fight cancer, weather prediction, and converting text into movie backdrops.

Investing

  • Optimistic Investors – US investors expect their stock market to beat inflation by almost 16% per year!
  • That’s about triple the historical result (within the US).
  • Below is a chart showing the returns of the S&P 500 (representing large US stocks) over different time periods.
  • Over the past 1, 5, and 10 years, performance is well above average:
  • Predicting the Future – It’s impossible to predict the future, but its fun to try.
  • US stocks were positive in January, February, and March. According to Carson Research, the previous 20 times that happened since 1950, the rest of the year – meaning the final nine months – were higher 19 out of 20 times:

Inflation

  • Food Inflation – Chances are you are spending more at the grocery store and at restaurants.
  • US consumers spent an average of 11.3% of their disposable income on food in 2022. As a share of spend, this level has not been reached since the 1980s:
  • Gas – Another high-profile area of spend is gas. The national average is approximately $3.60.
  • That will feel cheap to Californians, where the average price of regular of $5.35.
  • Dimes also cost more to make than they are worth:

College Costs

  • Average College Cost – If you have kids approaching college age, you might be interested in the following data points:
      • At private, nonprofit four-year colleges about 16% of students paid full sticker price (2019-20).
      • At in-state public colleges, about 25% of students paid the posted sticker price (2019-20).
      • Net Price: The calculator from the US Department of Education is a helpful tool. It aims to show you the amount a student will pay in a single academic year after subtracting scholarships and grants the student receives.
      • To dive further into specific college costs, some colleges offer merit estimators on their websites.
      • Or if they do not, you can check the college’s “common data set,” which among other things includes information on financial aid awarded. (Search online for the college’s name and “common data set” if you don’t find it on a school’s website).

I hope you found these interesting.

As always, please reach out if you have any questions or would like to connect.

First Quarter Investment Commentary

First Quarter Investment Commentary

Summary

  • Markets continued to rally in March, with the S&P 500 marking its fifth consecutive month of positive returns.
  • Inflation remained higher than preferred, but overall continued in the right (downward) direction.

Market Returns

Market Overview
Stock markets performed well in March, building on prior strength.

For the quarter:

  • Developed International Markets gained approximately 6%.
  • Emerging Markets stocks lagged, but were still up 2.4%.
  • Bonds were flat to slightly negative.

The Federal Reserve & Interest Rates

Expectations from The Federal Reserve indicate that while inflation will likely cool through the year, it may not decline be as quickly as previously anticipated. The Federal Reserve’s preferred inflation measure showed that prices rose as expected in February, putting a spotlight on whether price growth will decline enough to justify an interest rate cut by midyear.

The Federal Reserve left its key interest rate unchanged during the quarter and the Federal Open Market Committee (FOMC) maintained its outlook for three rate cuts in 2024.

Parting Thoughts

Many major indexes hit all-time highs during the quarter. 

While all-time highs can often result in investors wondering if they have missed the gains of the market, and consider waiting for a pullback to invest further, the data shows that is unlikely to be a successful strategy.

In fact, according to J.P. Morgan, investors are just as well off – or sometimes better – by putting money to work on days that hit all-time highs vs other days.  

Chart source: J.P. Morgan Guide to the Markets. FactSet, Standard & Poor’s.
**”Invest on any day” represents average of forward returns for the entire time period whereas “Invest at a new high” represents average of rolling forward returns calculated from each new S&P 500 high for the subsequent 3-months, 6-months, 1-year, 2-year and 3-year intervals, with data starting 1/1/1988 through 12/31/2023.