
Fourth Quarter & 2023 Investment Commentary

Fourth Quarter & 2023 Investment Commentary

In 2023, the economy, stock market, and bond market all performed well.

This was a very different year than 2022, which had negative stock returns, bond returns, and high inflation. Many economists  predicted those bad times would continue, with a recession in 2023.

Luckily, that did not happen. The year did get off to a rough start, with three big bank failures: Silicon Valley Bank, First Republic, and Signature Bank. These were three of the largest bank failure in US history:

What also served as a headwind was the Federal Reserve raising interest rates. They did so four times in 2023 in order to mitigate the risk of further inflation.

Largely as a result of a declining inflation, resilient consumer demand, and a competitive labor market, no recession occurred. As we’ve seen before, investors who remained disciplined were rewarded with favorable returns.

Tech of the Year: AI
A notable theme of the year was AI, which was highlighted by the launch and popularity of ChatGPT. Despite AI’s decade-plus presence (Siri was launched in 2011), this felt like a catalyst for the industry.

Side bar: It’s interesting to think about what other technology is available today, but not yet at its full potential. 3D printing?

Back to AI, Nvidia showcased the sector’s strength by being the top performer in the S&P 500:

Nvidia’s excellent year also serves to highlight the difference between 2022 and 2023.

Below, we see how “The Magnificent Seven” – the 7 largest stocks in the S&P 500 (all tech) – performed in 2022 (poorly) versus 2023 (very well):

Fourth Quarter Economic Highlights

  • Economic Growth: The economy continued its impressive performance, exceeding expectations with GDP growth of approximately 2.5% in the 4th quarter, more than double the analysts’ initial forecast.
  • Inflation: The Federal Reserve’s preferred measure of inflation decreased to 2.6% in November, down from 7% in 2022.
  • Interest Rates: Due to declining inflation, the expectation is that interest rate hikes are behind us, with potential rate cuts in 2024.

Stocks – Fourth Quarter Results:

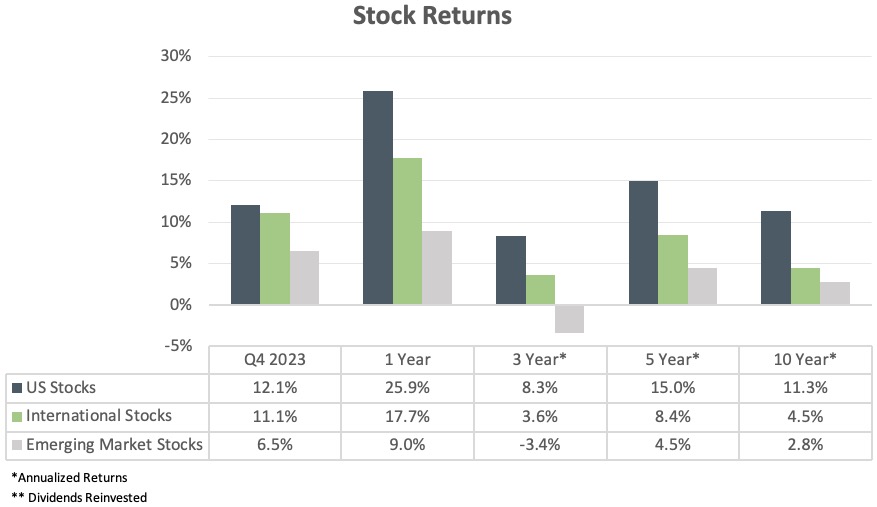
  • US Stocks: US stocks rose 12.1% during the quarter and 25.9% for the year. November through December was the 12th best two-month period for US stocks since 1950, with a gain of 13.9%. A historically good quarter.
  • International Stocks: Developed international stocks (e.g., Japan, Germany, Australia) rose 11.1% during the quarter and 17.7% for the year.
  • Emerging Markets: Emerging market stocks (e.g., India, Philippines, Brazil) rose 6.5% during the quarter (largely pulled down by China’s weaker performance) and 9.0% for the year.
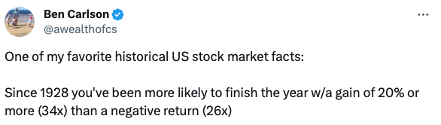
With a year of 20%+ returns behind us, I found this stat interesting:
Bonds
After a volatile year for interest rates, the US 10-Year Treasury – an important benchmark for lending – ended 2023 almost exactly where it started. Despite briefly reaching 5%, the 10-Year yield started and finished the year just under 4%.

This decline in interest rates drove the rally in bonds during the quarter.

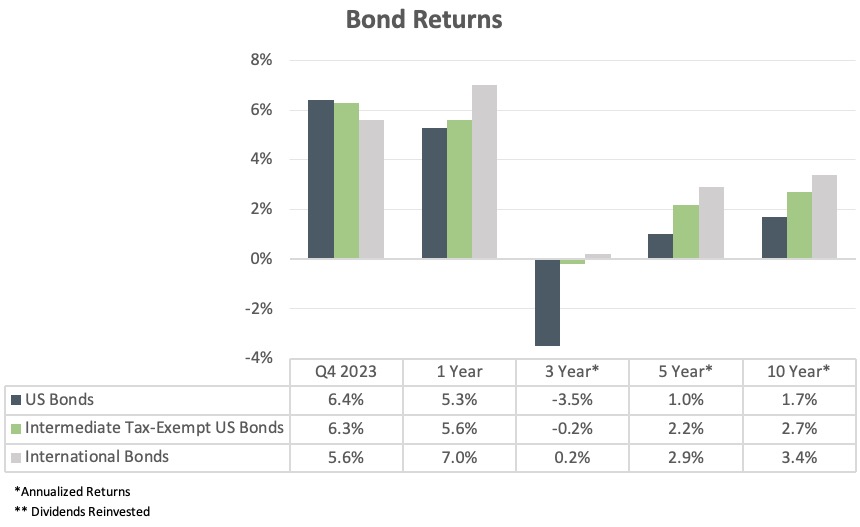
Over the past year, hedged international bonds showed the benefits of global diversification, as they outperformed US bonds.

For investors in tax-sensitive portfolios, municipal bonds have been one of the strongest sectors over the last year, with even better relative results when compared on an after-tax basis.
Parting Thoughts – Large Tech Stock Valuations
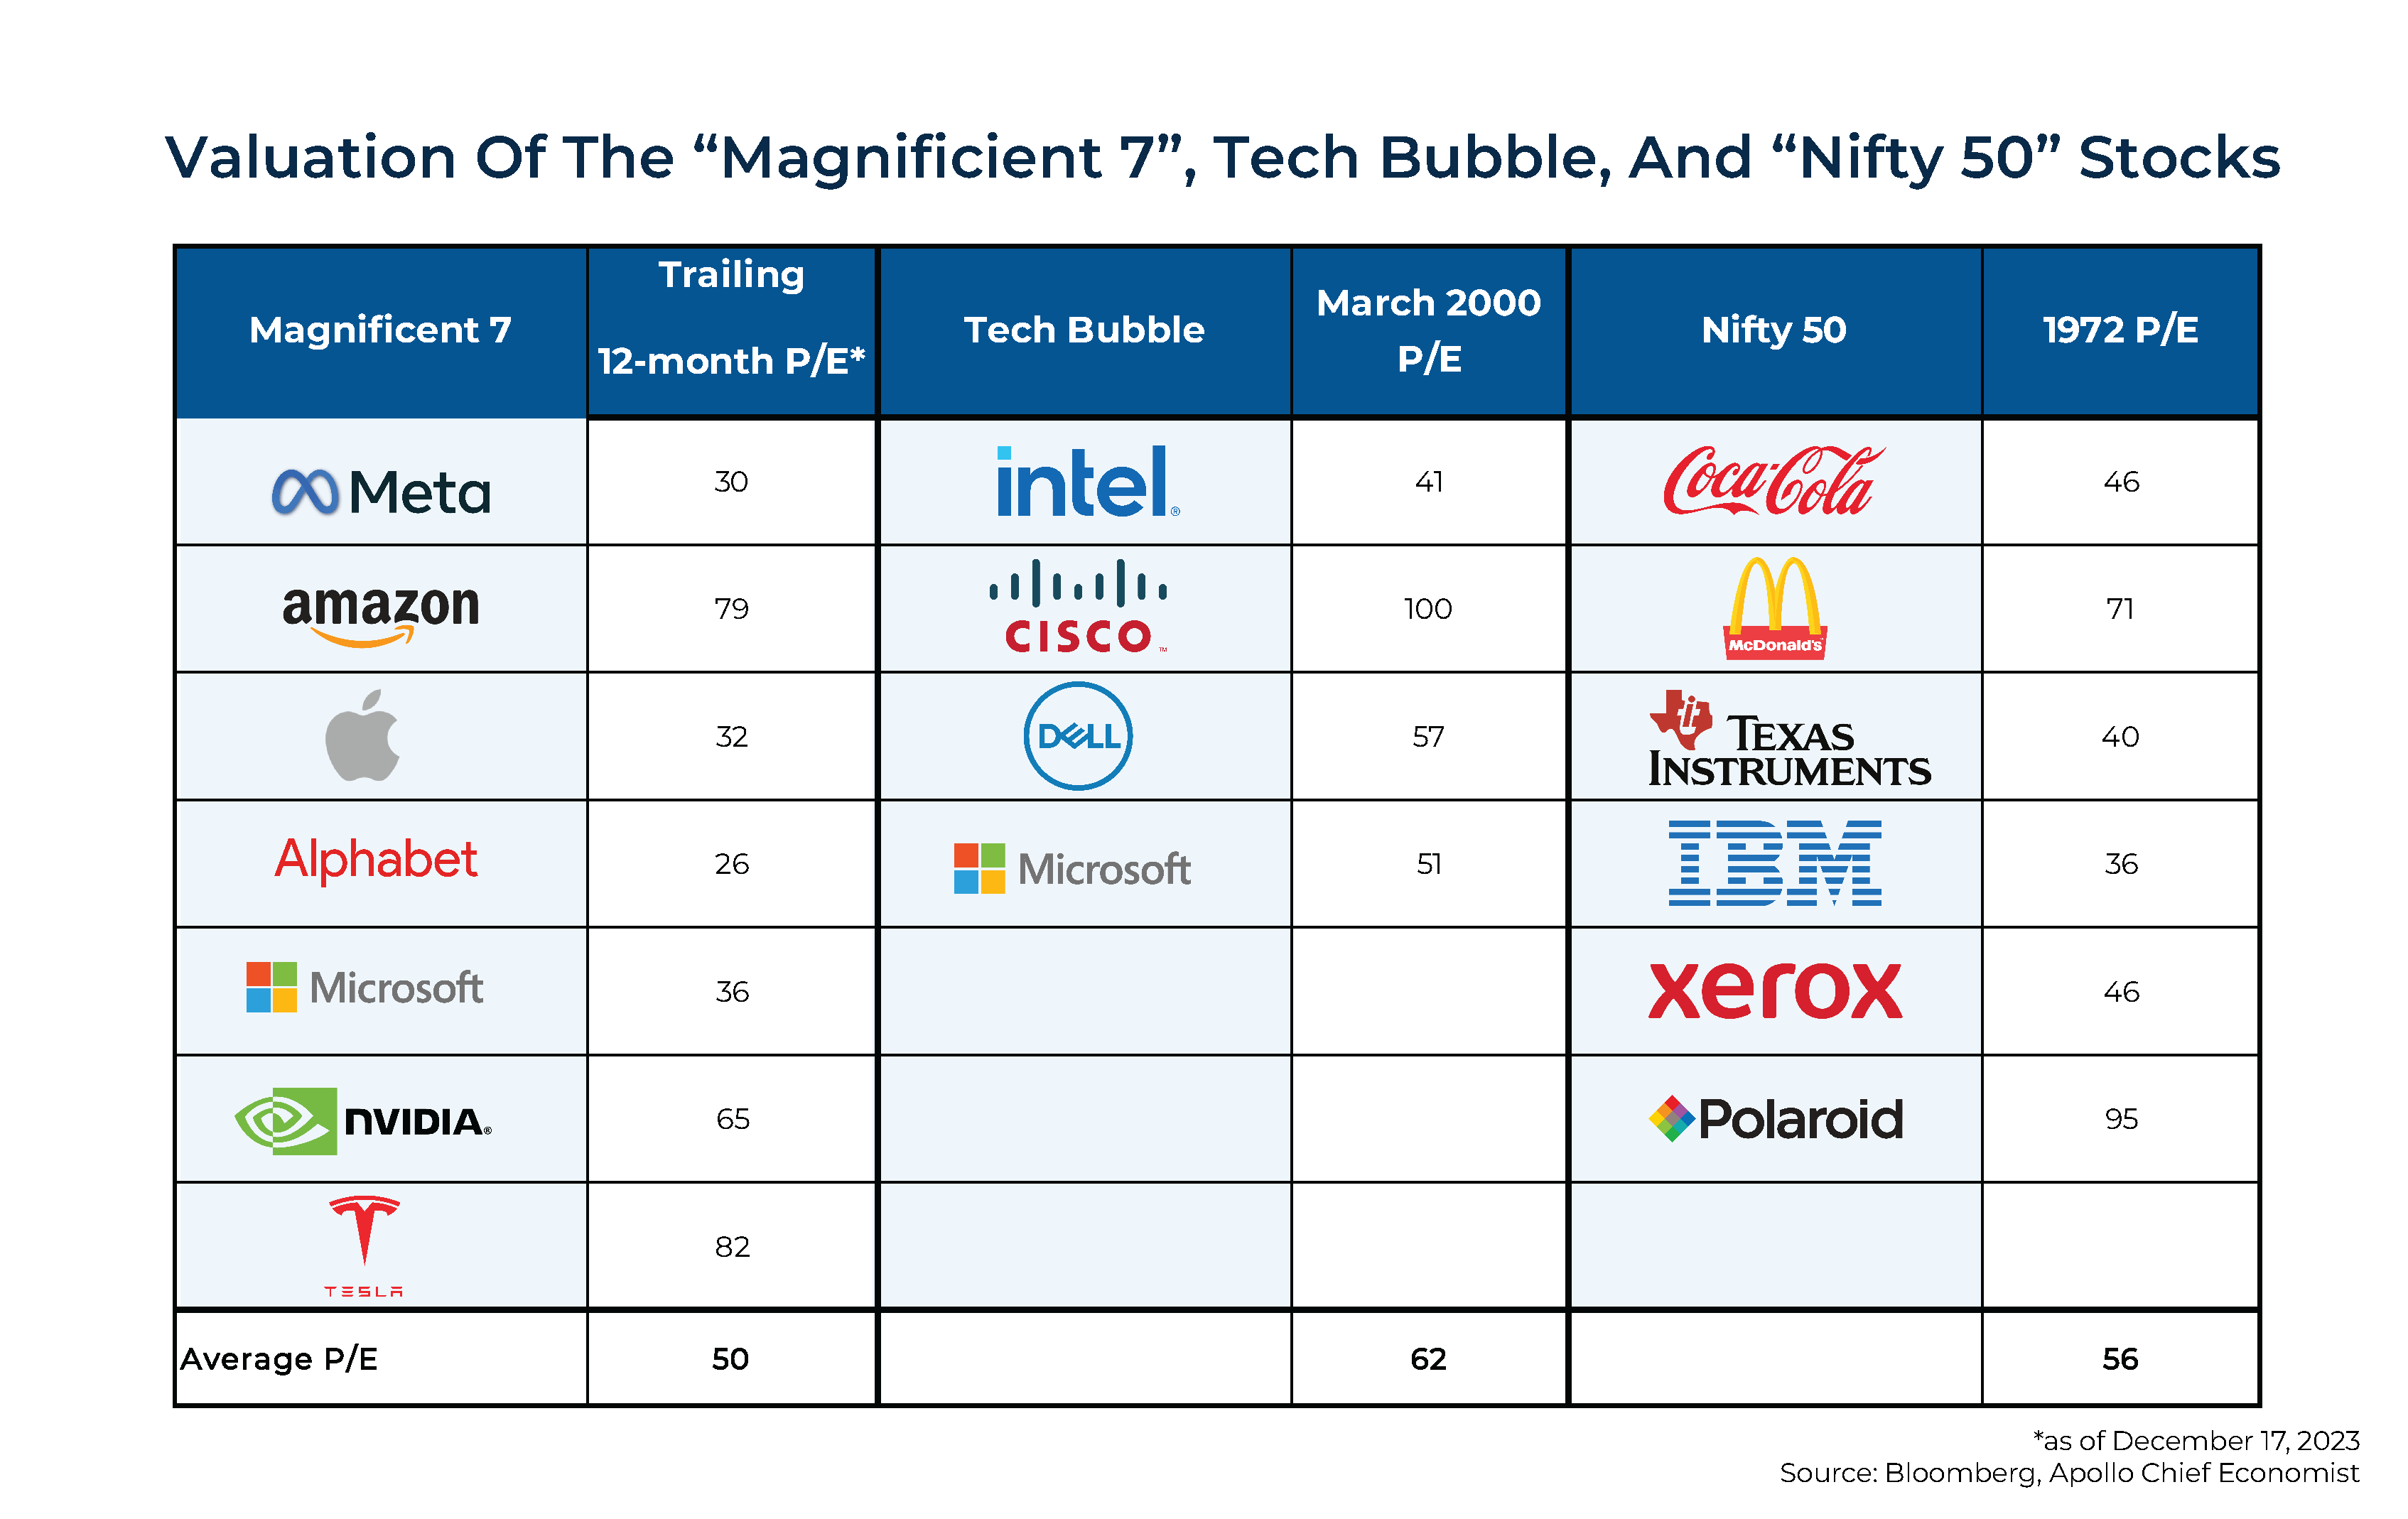
With all the fanfare around AI, I thought this analysis from Larry Swedroe was informative:

With an average P/E [price-to-earnings ratio] of 50, the valuations of the Magnificent 7 [the largest 7 companies in the US] are reminiscent of the high valuations of the Nifty 50 and the dotcom stocks just prior to their crashing.

While not a forecast of a crash, it is a warning that, at the very least, these stocks…are at historically extreme valuations.”
“For example, Vanguard’s U.S. Total Stock Market ETF (VTI) had a P/E ratio of 22.1, about its average over the last 40 years.

In contrast, Vanguard’s Total International ETF (VXUS) had a P/E of 12.5, well below its historical average. Similarly, the Emerging Markets Stock Index ETF (VWO) had a P/E of just 11.2.

Don’t let recency bias keep you from investing in asset classes that have performed relatively poorly, such as international stocks (relative to U.S. stocks) and U.S. small and value stocks (relative to U.S. large and growth stocks). Their valuations are now trading at historically large discounts, increasing the odds that they will outperform going forward.”

As always, please reach out if you have any questions or would like to connect.

Holiday Cheers & Monthly Market News

Holiday Cheers & Monthly Market News

I hope you’re enjoying the holiday season!

As year end approaches, I wanted to share a few encouraging statistics about the investment world and economy:

  • In November the S&P 500 (large US companies) increased by 8.9%. This was the 18th-best monthly gain since 1950. As a result, the index is close to an all-time high, last recorded in January, 2022.
  • Going back further in time, from December 31st, 2018, to December 12th, 2023 (just shy of 5 years), the S&P 500 has gained 102%. Said another way, US stocks have doubled over the last 5 years. That’s pretty amazing given the two bear markets (2020 and 2022), a worldwide pandemic, high inflation, and rising interest rates. 
  • Also in November, US bonds appreciated by 4.5%. This was their 8th-best monthly gain since 1976.
  • America’s third quarter GDP was revised up from 4.9% to 5.2%.
  • Gas prices are at their lowest level of the year, with a national average of $3.10 ($4.65 in CA).
  • On the employment front, the unemployment rate has been below 4% for 22 straight months. That hasn’t happened since the 1960s. The unemployment rate didn’t go below 4% once during the 1970s, 1980s or 1990s.

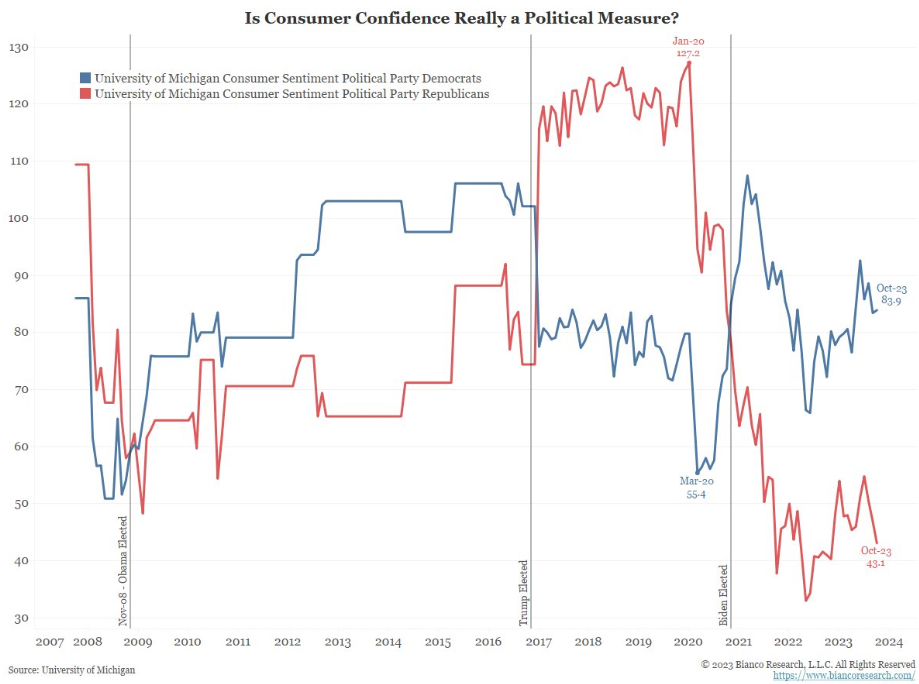
Despite these positive results, many people remain dissatisfied with today’s economy.

The chart below provides an excellent insight: It shows consumer sentiment by political party. Looking at the drastic swings when a presidential election occurs, it appears that the dominant factor in one’s outlook on the economy is how one identifies politically, and which party occupies the White House:

Personal Finance News

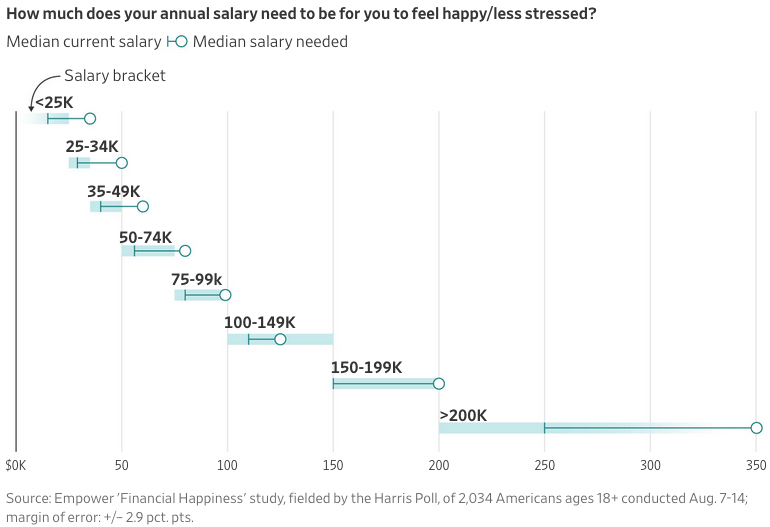
Empower surveyed people and asked how much money it would take to feel happy/less stressed.

The result: Across all income levels, everyone felt that earning more money would make them happier/less stressed. Even the highest earners surveyed, with a median income of $250,000, gave a median response of $350,000. Our desire for more is ever-present:

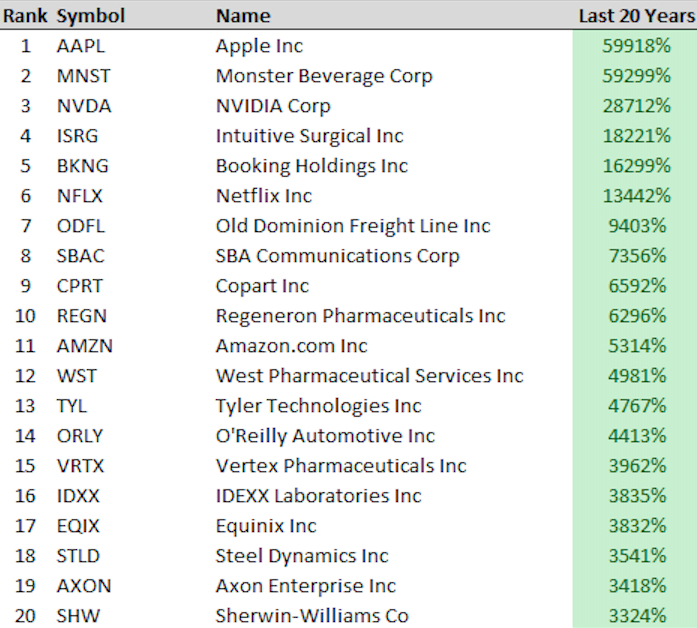
What’s the best-performing stock over the past 20 years?

If you guessed Apple, you’re right! It’s an amazing run, but also interesting to see what other companies are on the list. I don’t think many people would’ve guessed Monster Beverage would be #2:

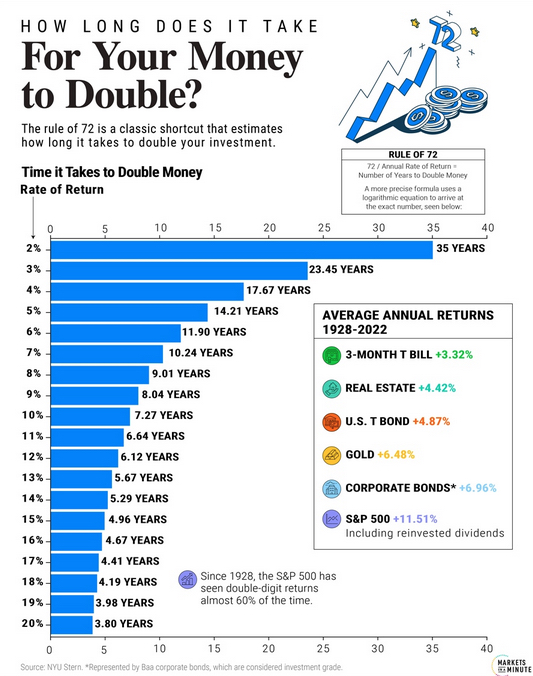
Speaking of investment returns, the image below from Visual Capitalist does a nice job showing how long it takes to double your money:

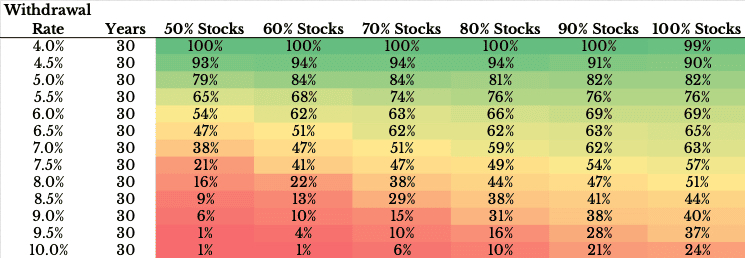
This research about the Safe Withdrawal Rate from your portfolio in retirement is interesting.

The green section across the top represents the safe withdrawal rate, where you would not have run out of money in nearly all historical periods. But as you move down the table – by increasing your withdrawal rate  – you become more likely to run out of money. So when you have a high withdrawal rate you actually need to take more risk to accommodate this higher need from your portfolio.

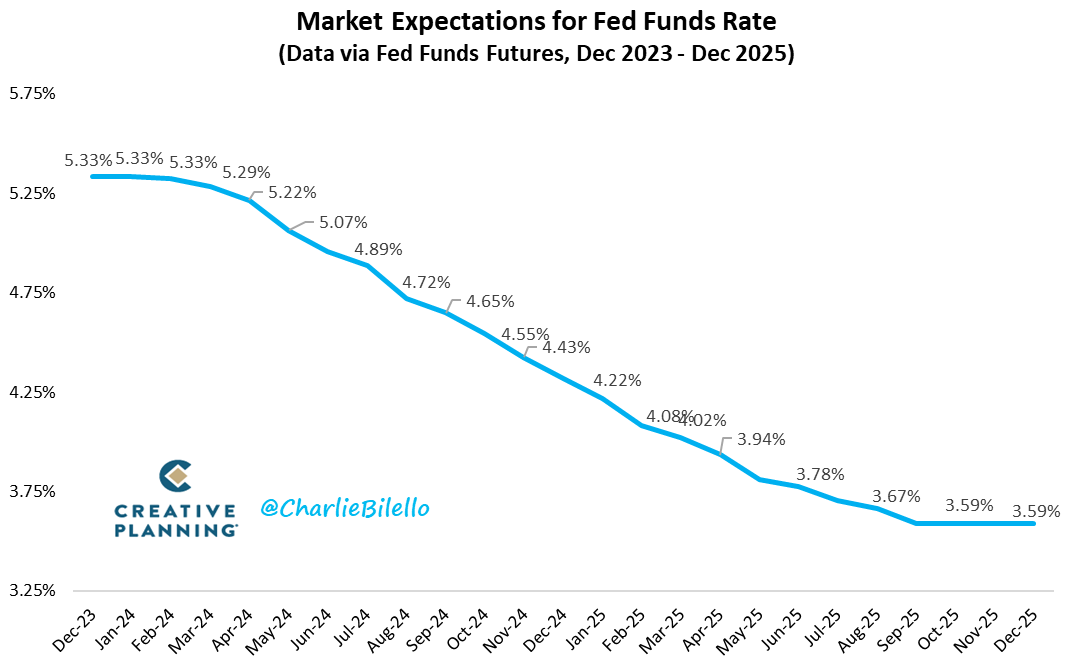
Interest rates are on a lot of people’s minds these days. Recently the Federal Reserve decided to hold them steady, and it’s projected that they’ll be reduced over the next few year. Here are the current projections for where they’re headed (take these with a grain of salt, as these projections move around a lot):

I hope you found these as interesting as I did.

As always, please reach out if you have any questions or would like to connect.
Happy Holidays!

Monthly News and Halloween Updates!

Monthly News and Halloween Updates!

I hope you had a great Halloween!

My wife and I took our daughter, Penny (now 19 months old), trick or treating.

She dressed up as her favorite character, The Very Hungry Caterpillar! We dressed up as her sidekicks, the food she ate. I was a watermelon and my wife was a lollipop.

We all had a great time, with Penny enjoying her first-ever candy bar (and ensuing sugar rush).

Onto the finance world, I came across a few articles and charts this past month that I found interesting and wanted to share.

Real Estate

I’m giving real estate its own section since there is so much interesting data. Here are a few charts that stood out.

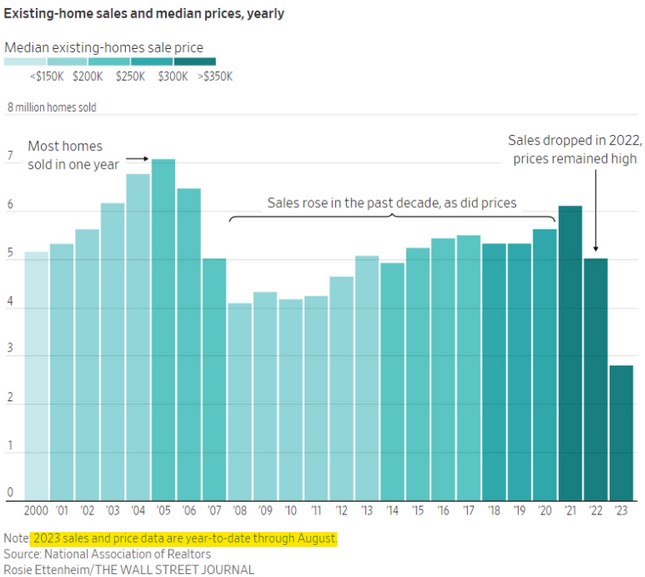
Home sales are on pace for their lowest annual total since 2008: 

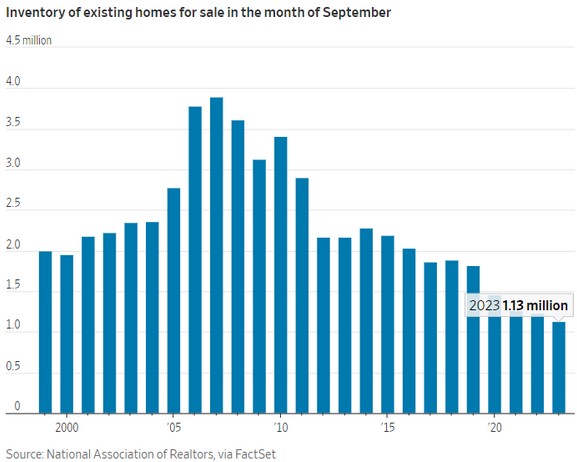
Supply (aka inventory) is low. There are fewer homes for sale today than any other time on record (going back to 1999):

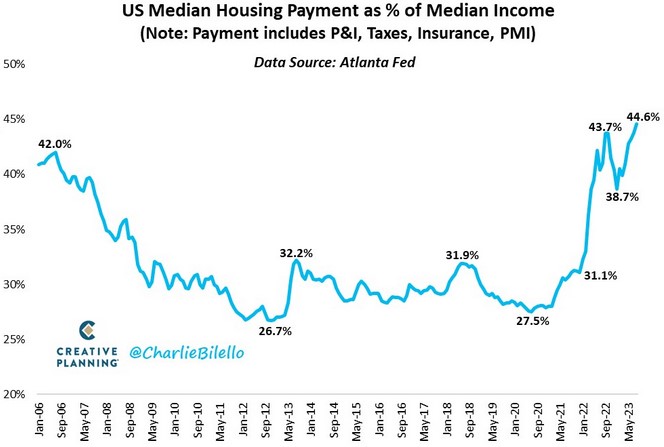
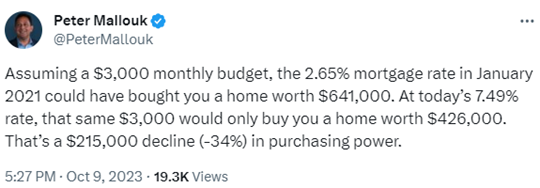
Given that mortgage rates are around 8%, and prices remain high as a result of low inventory, home affordability metrics are awful.

The median American household would need to spend about 44% of their income to afford the median priced home, a record high:

And lastly in real estate news, the way realtor commissions are paid may change in the next few years. The results of a recent verdict between the National Association of Realtors (NAR) and a group of sellers stated that sellers would no longer be required to pay the buyers’ agents commission. Agents would then be free to set their own commission rates. The NAR has promised to appeal, and the Department of Justice would need to edit the current rules, so we’ll see where this ends up.

I hope you found these helpful! As always, please reach out if you have any questions or would like to connect.
Third Quarter Investment Commentary, 2023

Third Quarter Investment Commentary, 2023

The third quarter usually provides the worst returns of the year. This year, it lived up to its reputation, with stocks and bonds both down modestly.

These negative returns followed one of the strongest starts ever for the stock market. In the first two quarters, the S&P 500, representing the 500 largest stocks in the US, experienced its 13th best start to a calendar year on record.

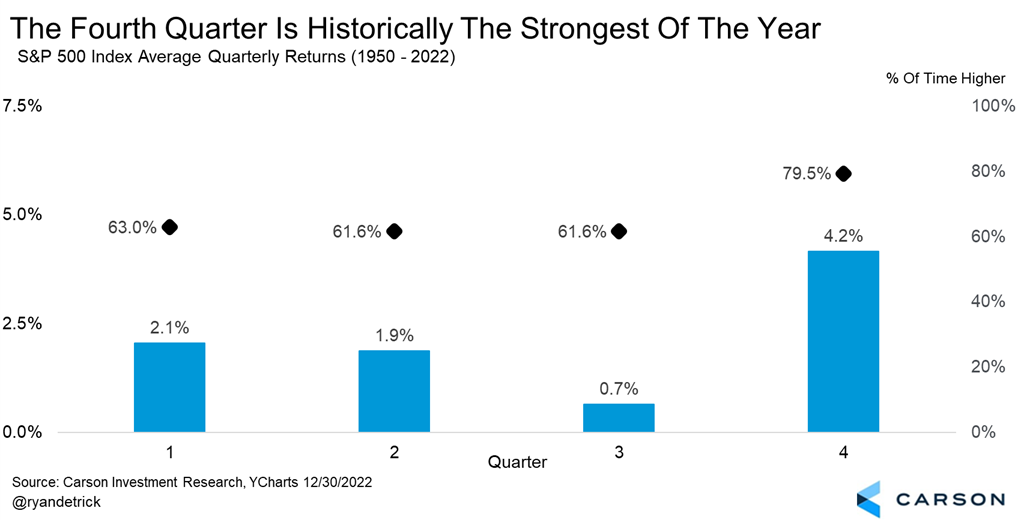
After what felt like a long Q3, most investors are probably looking forward to winter. Historically, the fourth quarter has been the best performing, up 4.2% on average, and positive 79.5% of the time:

    Economic Summary
    Looking at the economy, we’ll start off with the good news: the economy remains in surprisingly great shape. So much so that The Economist recently compared it to the Energizer Bunny. It just keeps going and going:

    “…a steady stream of better-than-expected data has left analysts scrambling to lift their forecasts. New orders for manufacturing firms reached their highest in nine months in July. Retail sales were perky last month, too, with consumers splurging on everything from restaurant meals to online shopping and clothing to sporting goods. The construction industry has also been buoyant, supported by a rebound in homebuilding. Underpinning all this is the labor market, which has remained hot, making it relatively easy for people to find work at decent wages. The total number of jobs in America has been growing faster than the working-age population, helping to keep the unemployment rate at 3.5% [now 3.8%], just shy of a five-decade low…America’s economy is not just holding up but steaming ahead.” (emphasis added)

    To add to this impressive list:

    • GDP growth for Q3 is projected to be 5.1%. This would be the highest GDP reading since Q4, 2021.
    • On the labor market front, September’s nonfarm payroll numbers, which encompasses employment data for approximately 80% of the US workforce, rose by 336,000. This surpassed economists’ expectations by double and exceeded the average monthly gain of 267,000 over the past 12 months. Moreover, employment data for July and August saw upward revisions, totaling 119,000 more jobs than previously reported.

    These positive outcomes occurred despite the Federal Reserve’s interest rate hikes, a move that typically slows the economy.

    The concern now is that, with the economy remaining resilient and generally doing well, inflation may persist if consumer spending remains high. That could prompt the Federal Reserve to keep interest rates elevate for longer than was originally planned.

    Oddly enough, good economic news can end up being viewed as bad news. Positive results end up causing concern about the future.

    The primary worry is that if high interest rates remain they could dampen consumer spending through high rates on mortgages (currently 7.6%), auto loans (currently 8.3%), and credit cards (currently 21.1%).

    Additionally, there are several other potential risks to keep in mind:

    • Inflation has declined and is now under 4%, a decrease from last year’s high of 9%. However, this is still higher than the Fed’s target of 2%. In simpler terms, prices are still rising, but the rate at which they’re going up has slowed. This can be seen at the gas pump, where prices have increased 12.9% over the last two months.
    • There remains a looming threat of a government shutdown.
    • Student loan payments just resumed, and it’s unclear how much that will affect overall spending.
    • Last but not least, the two wars between Russia-Ukraine and Israel-Palestine seem to be intensifying, each with their own unique geopolitical risks.

    Risk is an ever-present part of investing (more on that at the end of this newsletter). But it’s usually the risks that nobody sees that end up causing the most damage.

    Housing Market
    Before diving into the stock and bond market returns, I wanted to touch on housing.

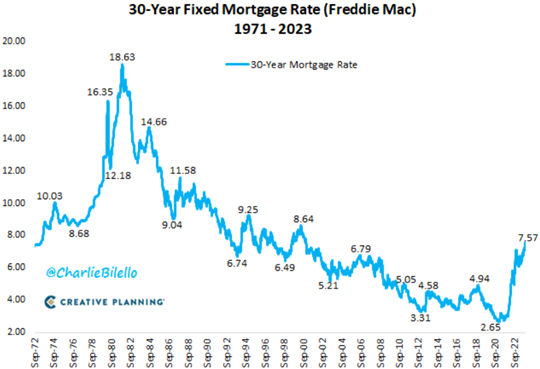
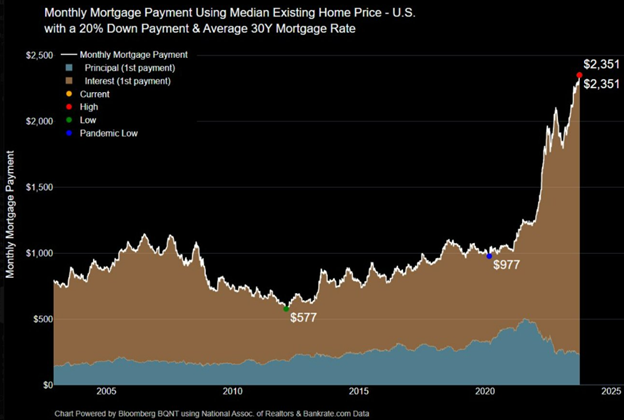
    With interest rates at 7.6%, the cost to purchase a home is high. In fact, interest rates haven’t been this high since 2000:

    As a result, the housing market has stopped booming, which feels odd given all the activity in recent years.

    House prices rose dramatically during Covid, as many white-collar workers moved while interest rates were low. Then inflation rose, interest rates followed, and home prices stopped going up (but they’re still currently at all-time highs).

    As a result of the run up in home prices and interest rates, home affordability is at an all-time low, as demonstrated by the following screenshots:

    However, housing is unique because most people aren’t affected by it. Over the past few years, many people moved or refinanced, and are content sitting still for a while. As a result, there aren’t many sellers, which is limiting supply.

    All in all, the market has slowed dramatically, with very few people refinancing, selling, or buying.

    Economic textbooks would show that an increase in interest rates would lead to a decrease in home prices, but it’s not always that easy. Just another example of how predicting the future is hard.

    US Stocks
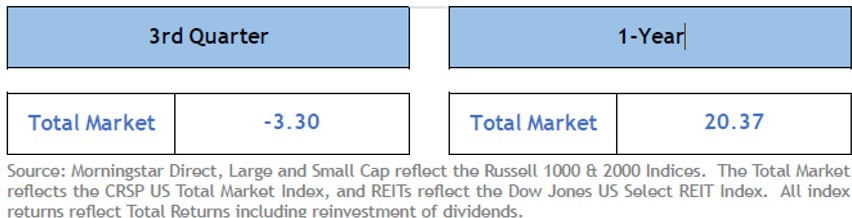
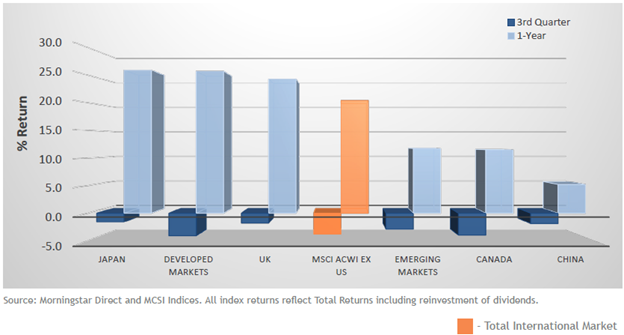
    After a strong run for the prior three quarters, US stocks fell modestly during the third quarter, down 3.3%, while they are up 20.37% over the past 1 year:

    During the quarter, energy was the best-performing sector, up 11.4%, as the result of higher energy prices.

    The worst-performing sectors were utilities (think of companies like PG&E and Duke Energy), and real estate, down 10% and 9.7%, respectively.

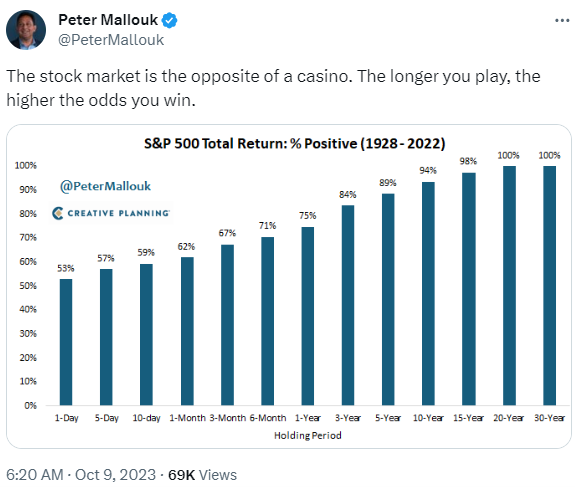
    As mentioned at the beginning of this post, it’s the long-term investing outcome that matters. As shown below, the longer your investing time horizon, the higher the likelihood of achieving a positive return:

    International Stocks
    Developed international and emerging markets stocks performed similarly to US markets for the quarter, with developed markets down 4.1% (as measured by the MSCI EAFE) and emerging markets down 3.0% (MSCI EM).

    Over the past year, developed international markets (think of companies located in countries like Germany, Japan, and Canada) outpaced the US, gaining 25%. Emerging markets (think of companies located in countries like India, Mexico, and Taiwan) gained 11.7%.

    Bonds
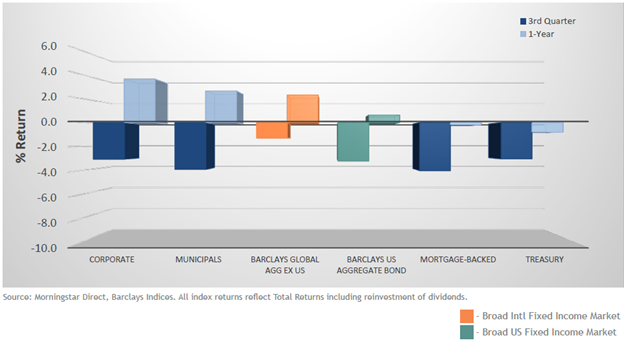
    Bond performance was negative across all sectors during the quarter. This was largely attributable to investors weighing recent economic data and Federal Reserve guidance. During the quarter, investors appear to have priced in a higher probability that the Fed may hold rates at higher levels throughout much of 2024.

    Over the past year, returns for fixed income investments have been modestly positive. More credit-sensitive sectors, like corporate bonds, have generated the highest results for the period.

    For investors in tax-sensitive portfolios, municipal bonds have been one of the strongest sectors over the last year, with even stronger relative results when compared on an after-tax basis.

    Parting Thoughts – Investing During Major Geopolitical Events
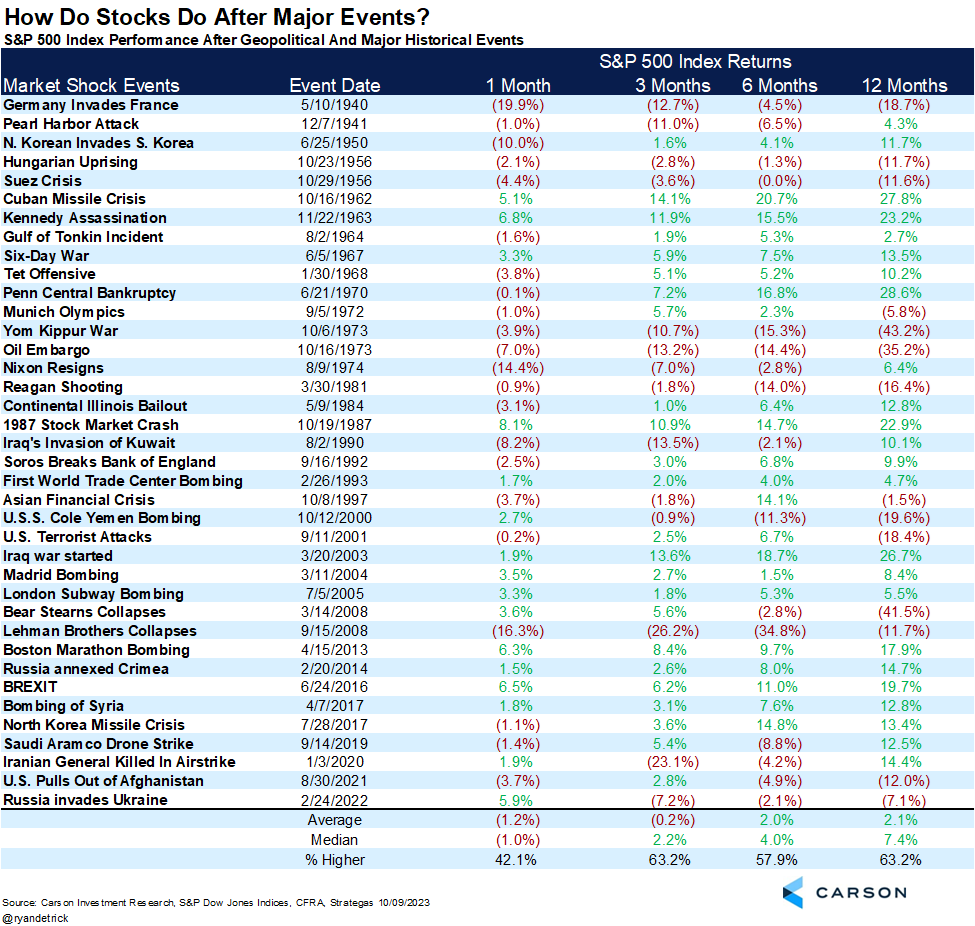
    Ryan Detrick from The Carson Group recently provided a table depicting the performance of the S&P 500 in response to geopolitical events.

    Looking at this extensive list, we see everything from the Pearl Harbor Attack to the Cuban Missile Crisis to the Kennedy Assasination, 9/11, and much more.

    The lesson I take is that market sell offs have generally been limited. And while some extended periods of weakness have occurred, the market typically recovers swiftly.

    This is because stocks reflect earnings over time, and companies persist in pursuing growth.

    If history is any guide to the future, we can learn that despite terrible and tragic news, the stock market consistently bounces back and rewards patient investors.

    As always, please reach out if you have any questions or would like to connect.
    How Employee Stock Purchase Plans (ESPPs) Work

    How Employee Stock Purchase Plans (ESPPs) Work

    ESPPs are a wonderful benefit that allow employees to purchase company stock at a discounted price.

    Here’s how they usually work:

    • Payroll Deductions: If you decide to participate (they’re optional), your employer will deduct a set amount from your paycheck.
    • Accumulation or Purchase Period: The money deducted from your paycheck is accumulated over a set window of time, usually six months.
    • Discounted Purchase Price: The company will look at the value of the stock at the beginning and end of the six-month window. The purchase price is based on the lower of those two prices, and then a 15% discount is applied.
    • Ownership: Congratulations, you now own company shares! You are free to continue holding them or sell them immediately. Importantly, you pay tax when you sell them, not when you buy them.
    • Sale & Taxes: If you sell the shares right after you purchase them, you can make a quick profit (since you just bought them at a discounted price). If you do this, the difference between the discounted purchase price and the sale price is subject to ordinary income tax. This is called a “disqualifying disposition,” which is not the most exciting name. To qualify for long-term capital gains tax (which is likely lower than your ordinary income tax rate), you need to hold the ESPPs for at least one year after the purchase date and two years after the offering date (the first day of the accumulation period). This is called a “qualifying disposition,” also not very a creative name.

    Overall, ESPPs are a great employee benefit. If you hold on to your shares and the company does well, you participate in that upside. The risk with holding on to them is that the shares depreciate and end up being worth less than what they were purchased for. However, you can eliminate that risk by selling them soon after purchase, when they are still positive.

    A few other notes about ESPP plans:

    • The money contributed is post-tax. Said another way, putting money towards your ESPP plan will not lower your taxes.
    • The maximum you can contribute is $25,000 per year.
    • Discounts, rules, and terms may vary between companies.

    Real-World Example

    Apple has two 6-month windows to participate in their ESPP:

    • February 1st – July 31st
    • August 1st – January 31st

    In the period that recently ended, the stock price at the beginning and end of the purchase window was:

    • February 1st: $145.23
    • July 31st: $196.45

    The February 1st price is clearly lower. A 15% discount is applied to $145.23, and as a result Apple employees bought the stock for $123.62!

    From there, they could sell it immediately for roughly $196, a gain of 59% before tax.

    In this scenario, the gain would be taxed at your ordinary income tax rate. If your state + federal income tax rate is 40%, your after-tax return would equal 35.4%. Not bad!

    To qualify for long-term capital gains, the stock would need to be held until February, 2024. A lot can happen to a share price over two years, so you shouldn’t hold on to stock simply because you could save on taxes. As they say, “don’t let the tax tail wag the dog.”